🖥️ Advanced: Local Grafana Dashboard
Setup
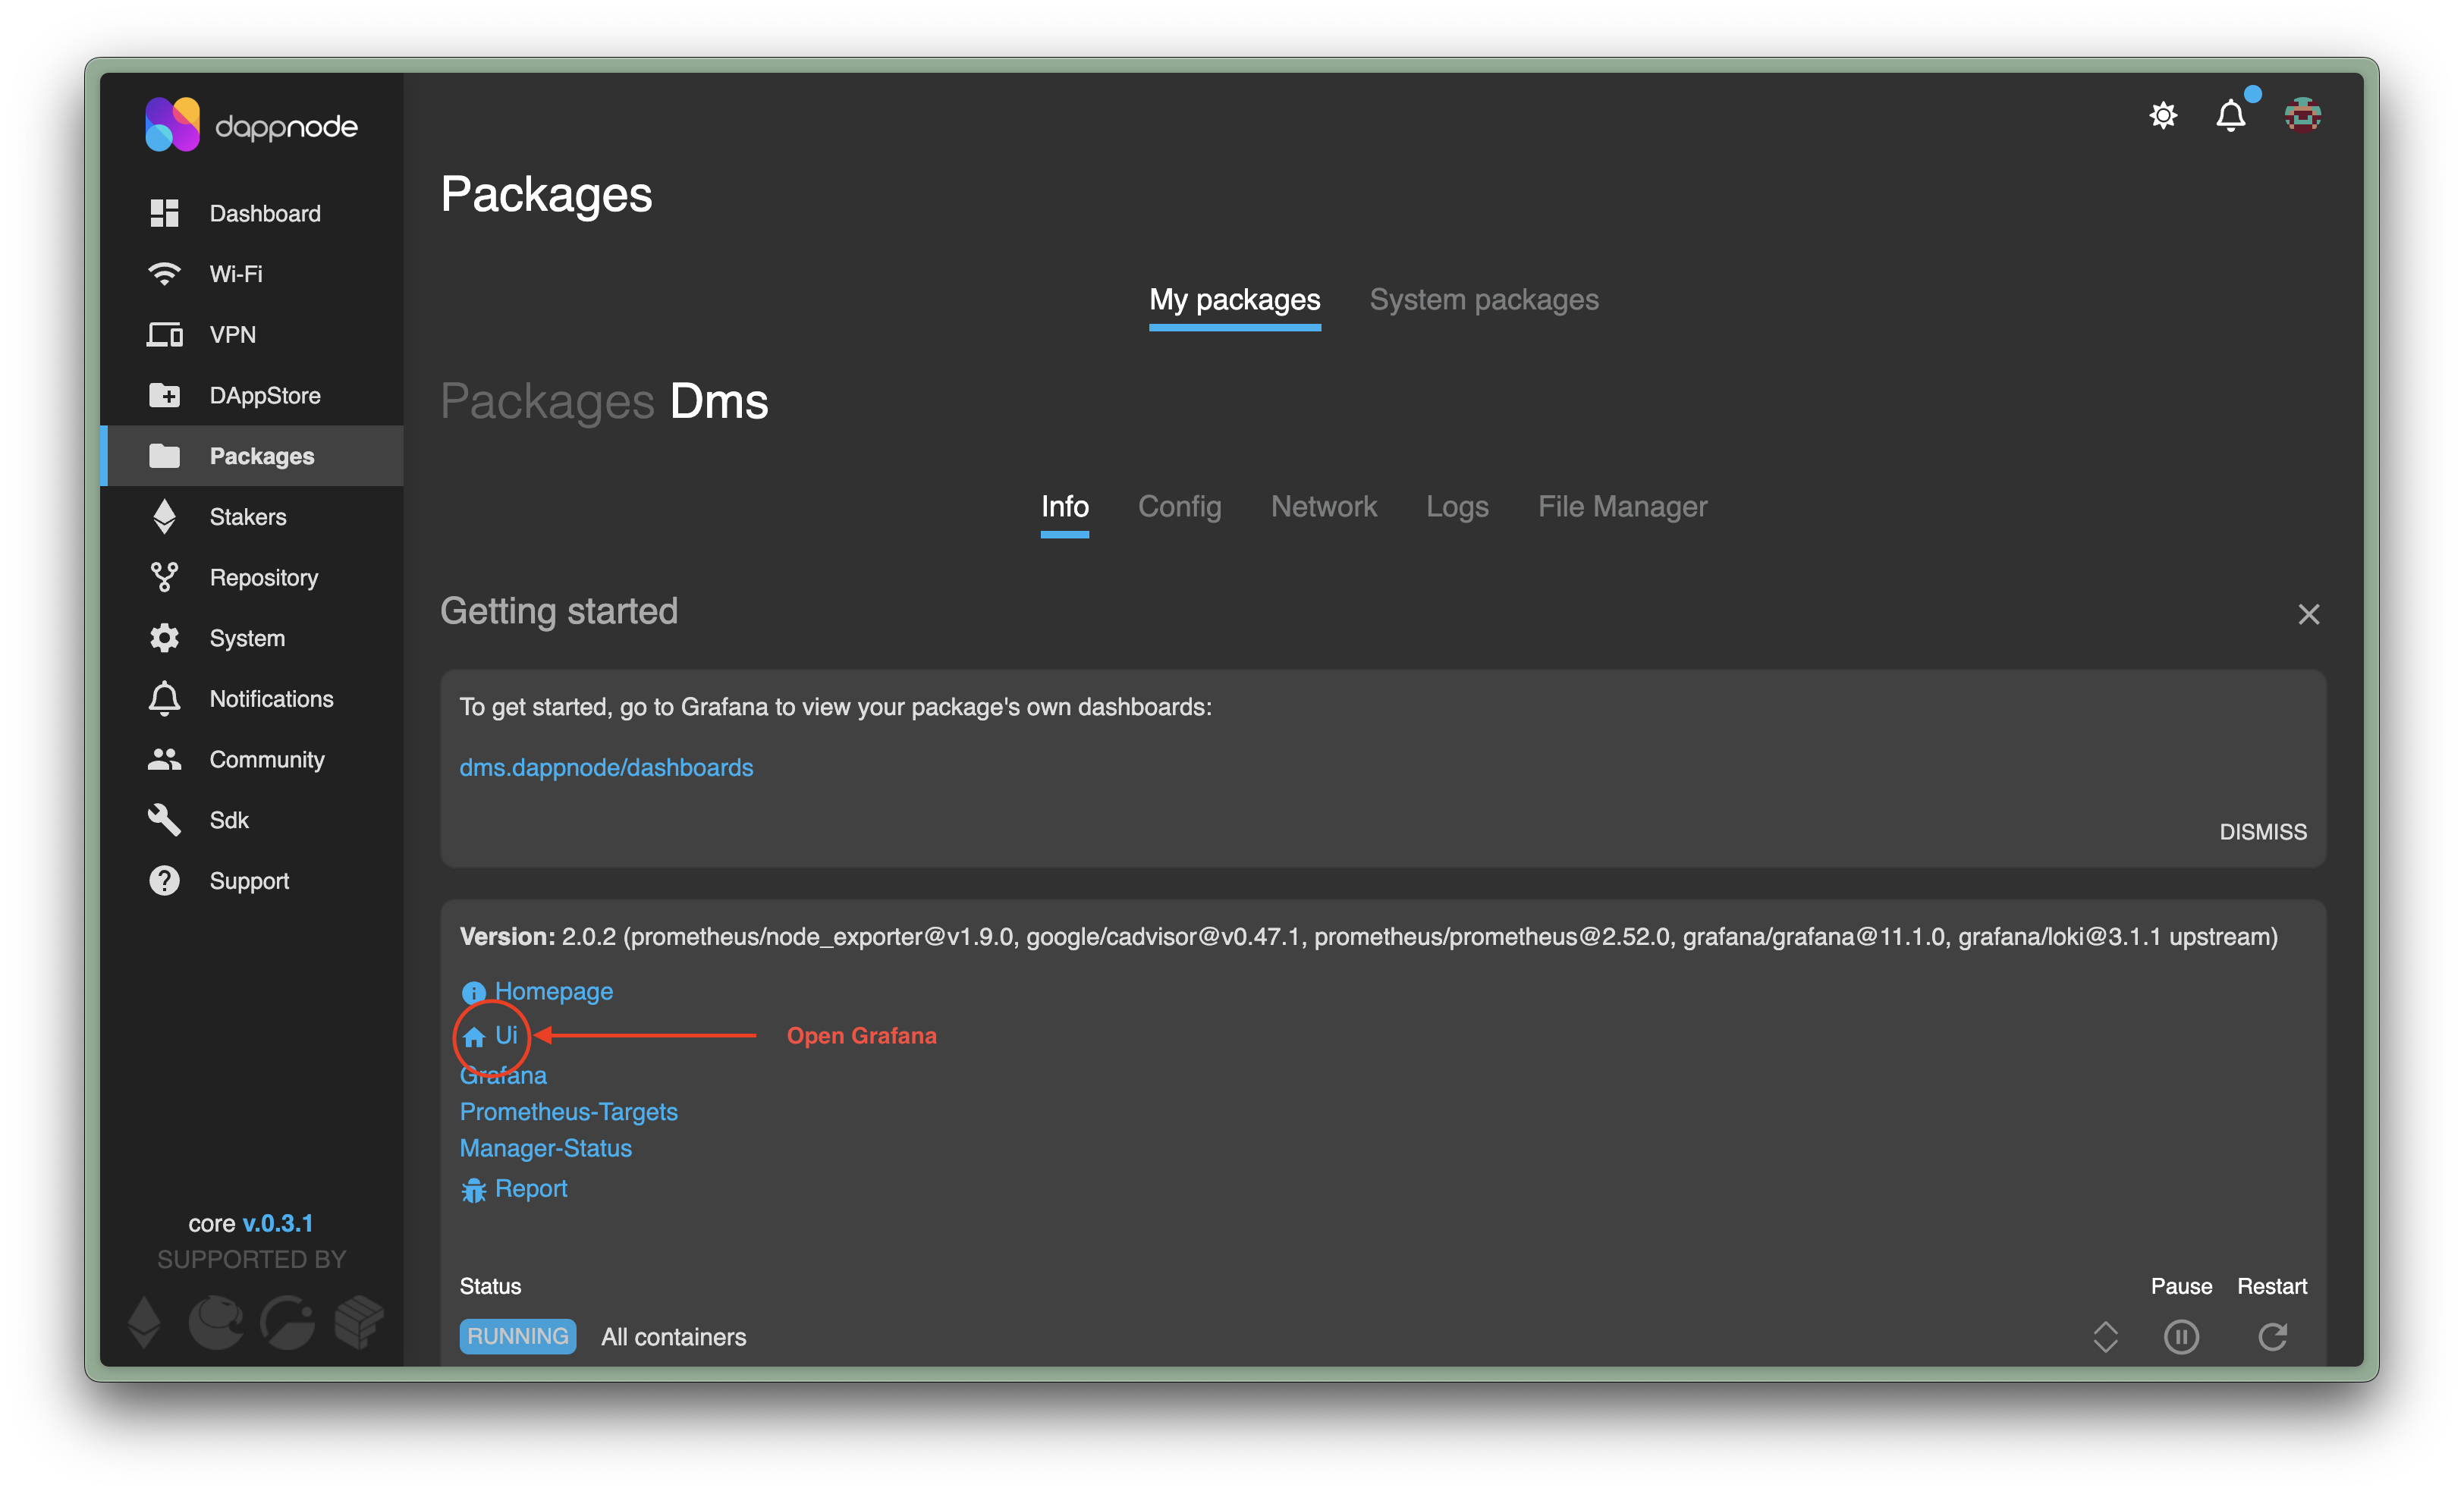
Dappnode
- Check if the Dappnode Monitoring Service (DMS) Package is already installed under Packages. Else, install it from the Dappstore.
- Access your Dappnode interface, go to the DMS Package, and open up the DMS dashboard.
EthPillar
Run ethpillar. Then navigate to 21. Toolbox » 2. Monitoring: Observe Ethereum Metrics. Explore Dashboards » Install.
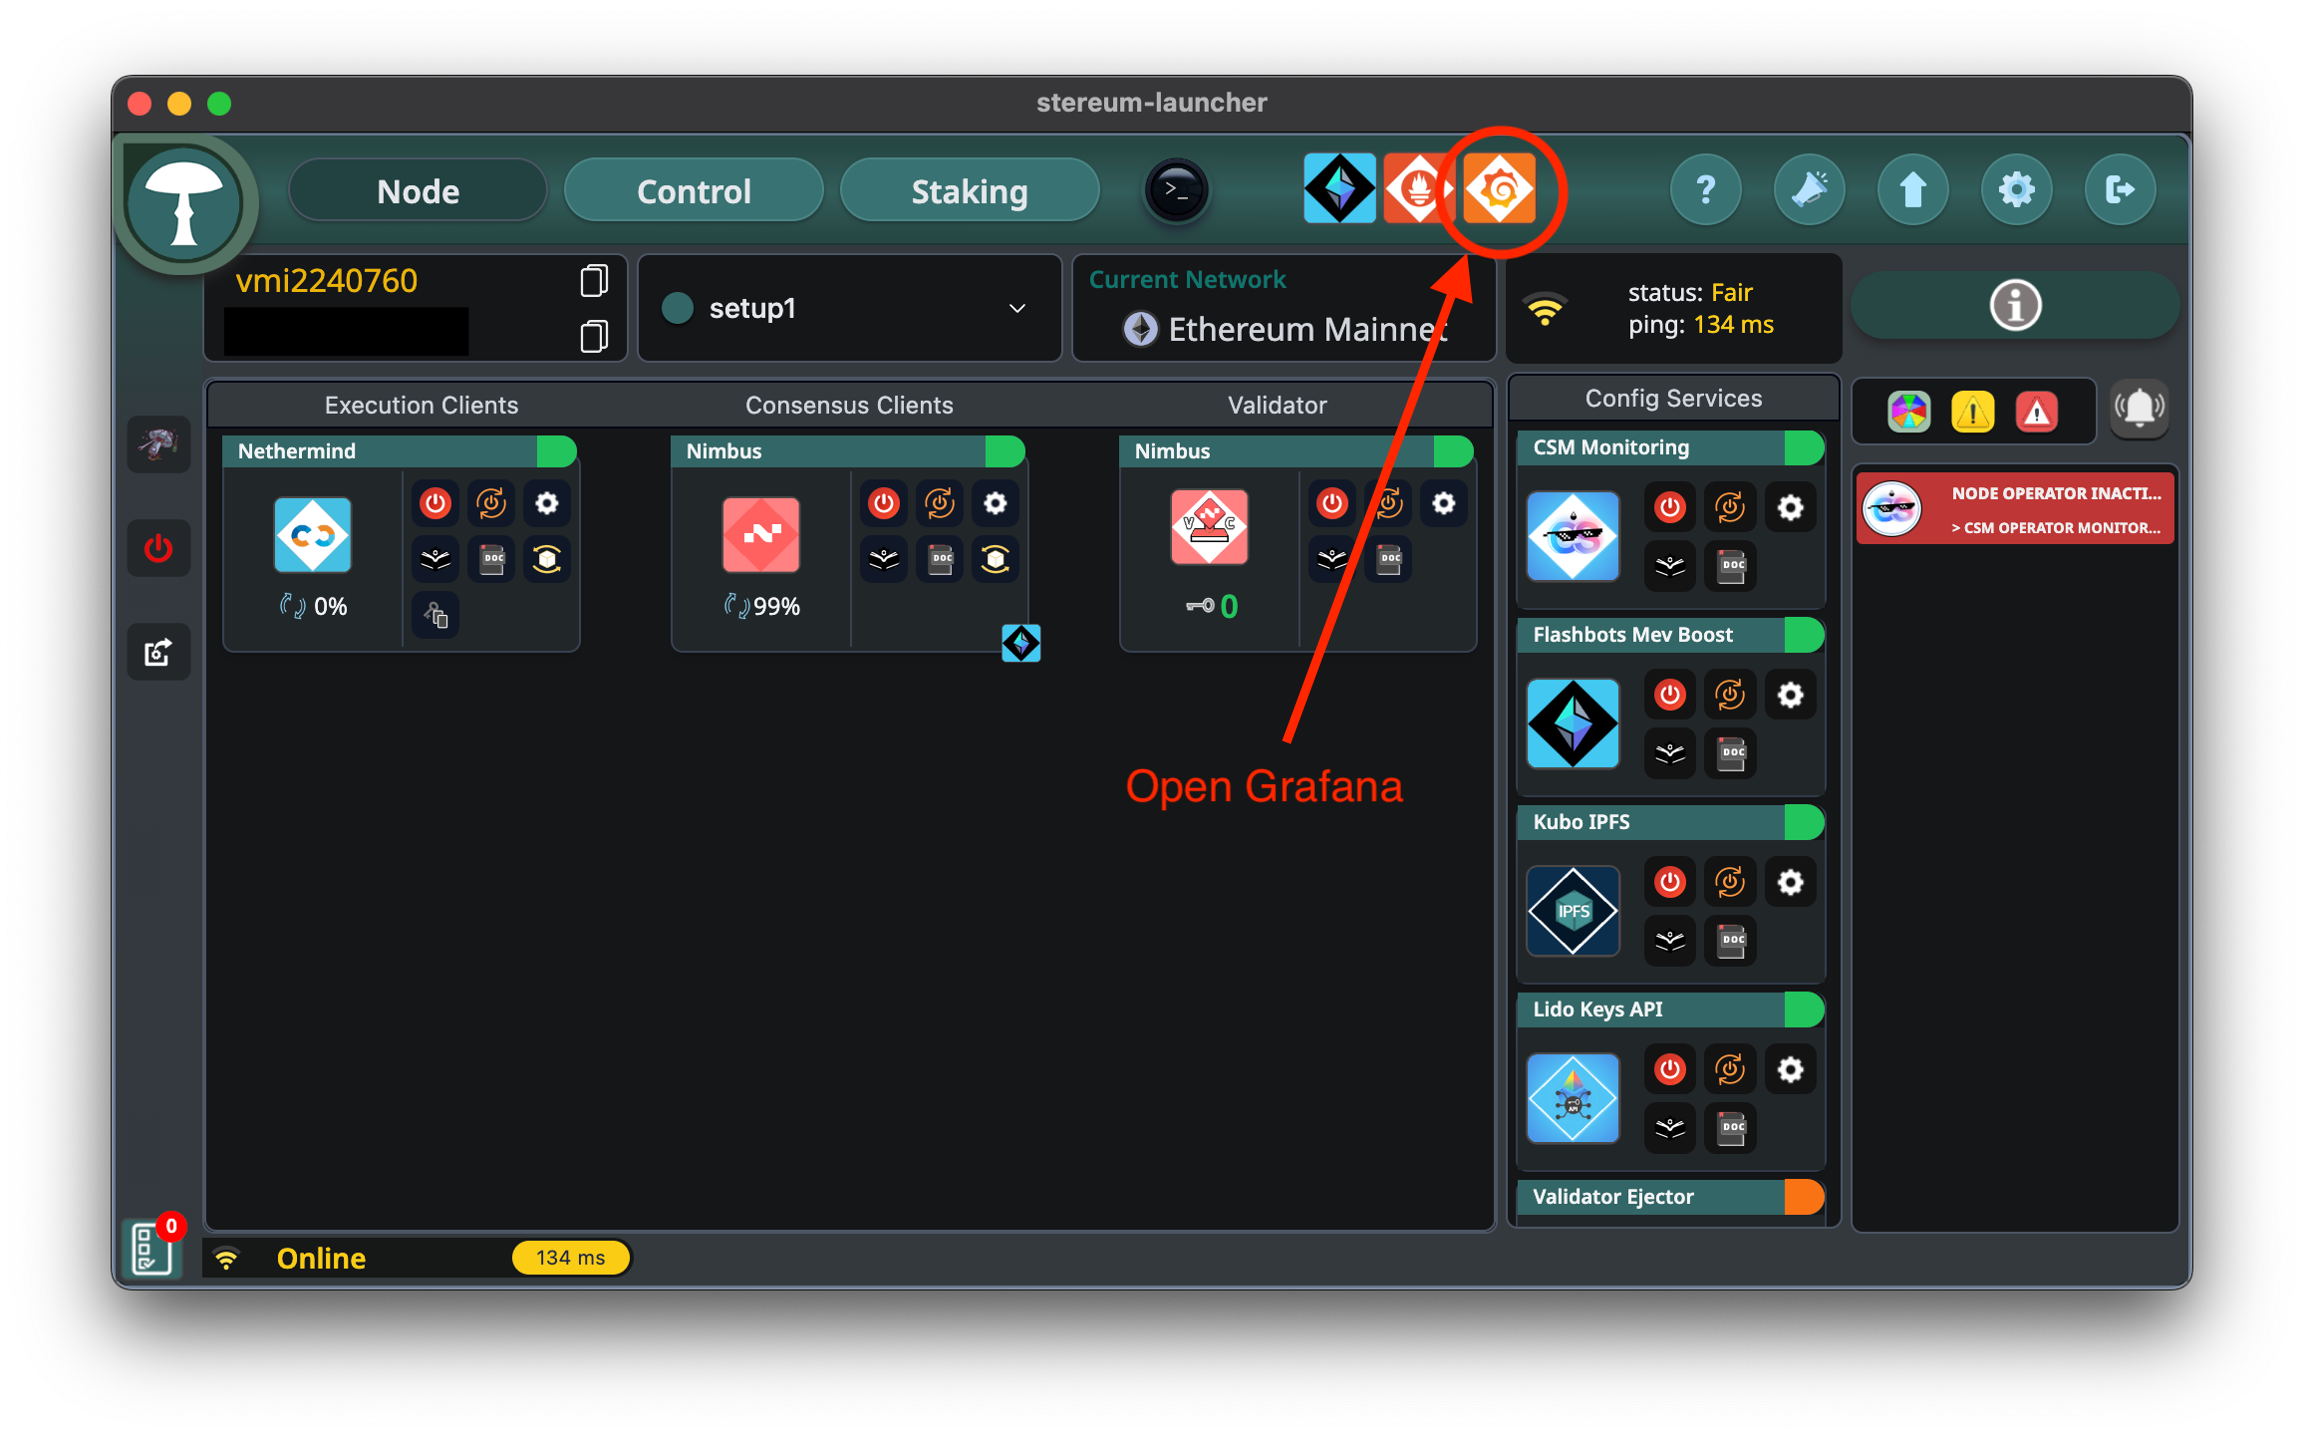
Stereum
You'll find a button to open Grafana at the top of the launcher screen. Click there and Stereum will open the local instance in your browser.
Sedge
Sedge deploys validators using Docker Compose and includes optional support for Grafana and Prometheus.
- If you enabled monitoring during setup, Prometheus and Grafana containers should be running
- You can edit your
docker-compose.yamlor.envfile to adjust data retention or expose metrics
Eth Docker
No additional steps required.
Systemd (Validator Client add-on only)
Edit the prometheus.yml configuration file.
sudo nano /etc/prometheus/prometheus.yml